Hello MSPbots Users!
This is Jack here PM on the BI side. We are currently working on redesigning the whole UI/UX of building widgets and would love to hear your feedback!
We have created a working Figma prototype, please give it a try and let us know what you think of it! Feel free to follow the instructions below or just click around in the prototype to see if it is easy enough to build without any instructions.
-
To get started, access the link here: https://www.figma.com/proto/eZGbBQkLNx7Wxz645Zn08y/Public-Design?page-id=0%3A1&type=design&node-id=1-9741&viewport=168%2C-90%2C0.21&t=GouQsmEerRiGBDbA-1&scaling=contain&starting-point-node-id=1%3A9741
-
After you access the link, the first step is to add a dataset where you will be pulling data from to your new widget.
-
The Dataset Selector pop-up will show up allowing you to search, filter and sort in order to find the dataset you are looking for. Since this is a controlled workflow, here you can select our example we have built which is the Jira Server Issue dataset.
-
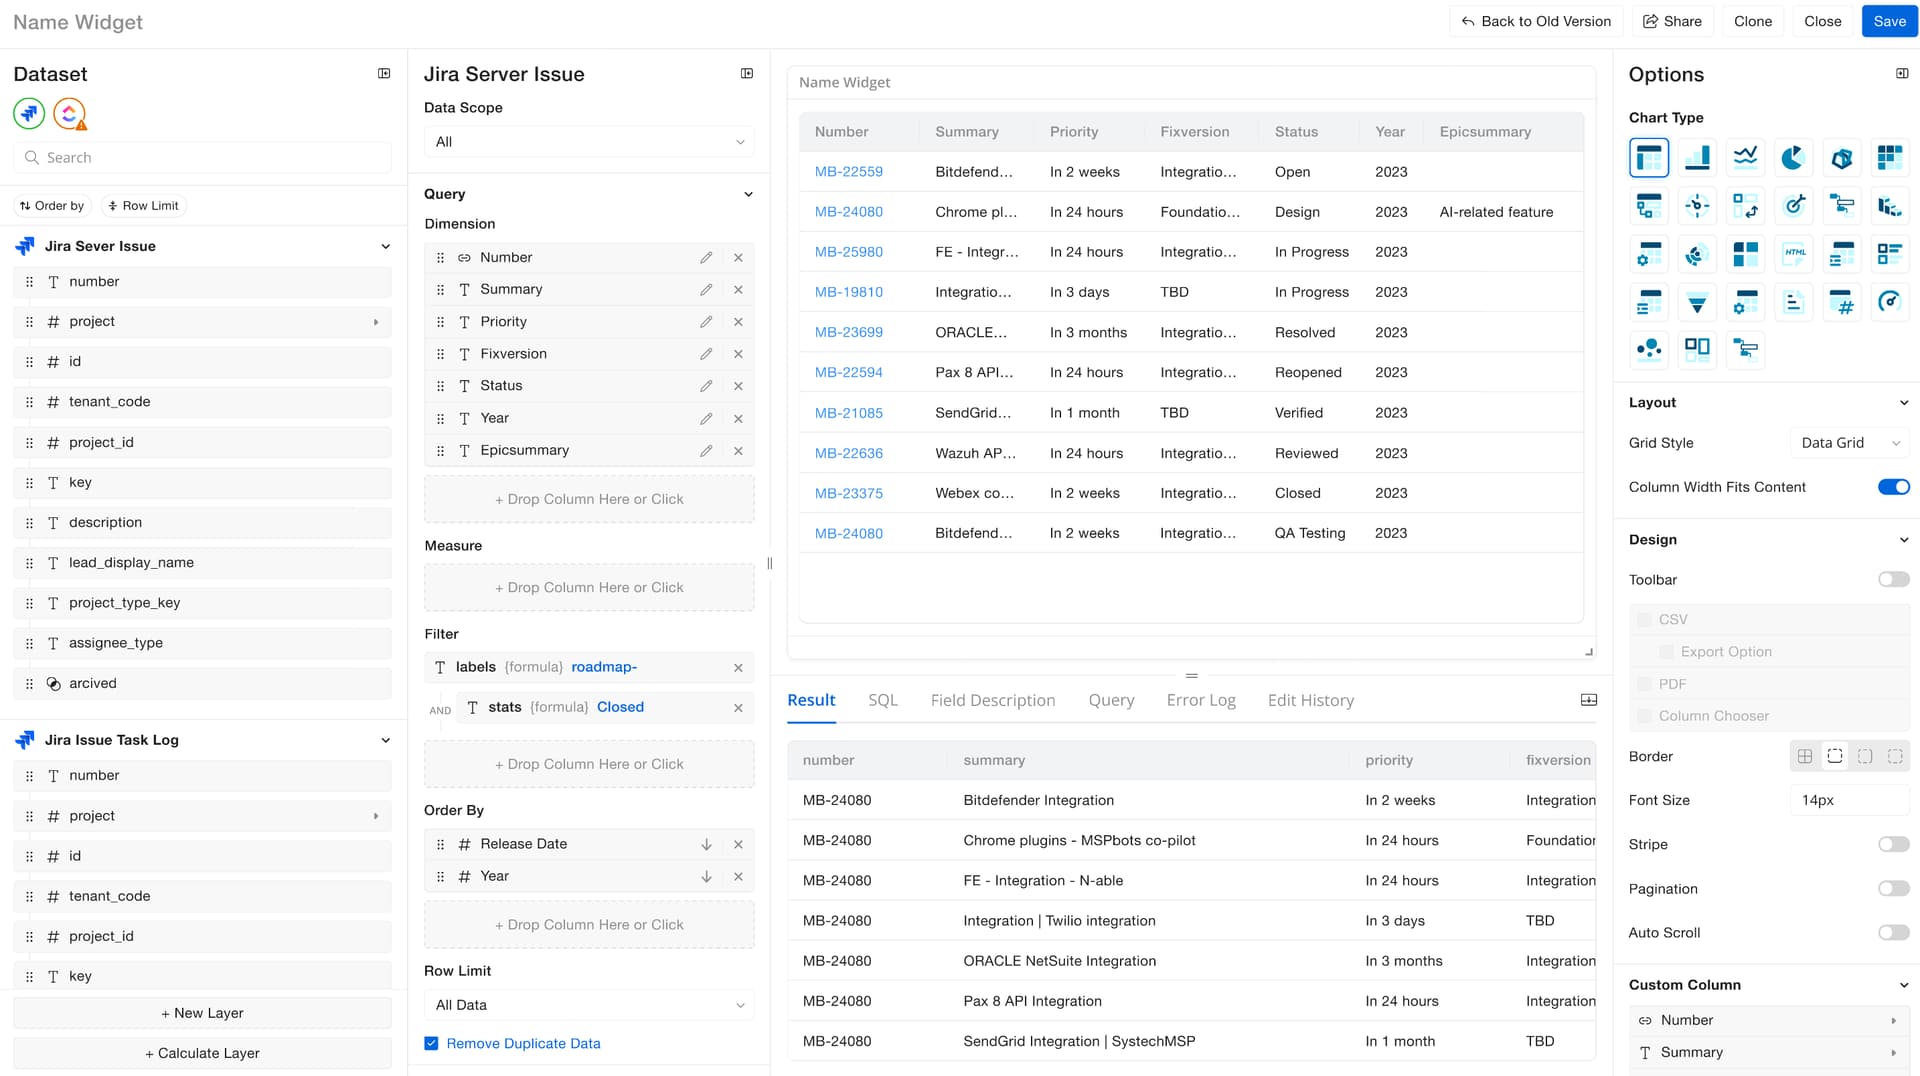
After selecting the dataset, it will transport you to our newly designed widget builder UI/UX.
-
Starting from the left is where you will see your available columns related to your dataset selected to be dragged and dropped into the builder in the next section. You can also add new layers and calculate layers.
-
The next section is where you drag your columns into for data to be displayed in the preview section. Here we have additional customization options available where you can measure, filter, order by, set row limits, etc.
-
Next we have the preview section where as you make an action on the previous section, you can see in real time the changes made to your widgets.
-
In the furthest right section, we have additional formatting options where you could change the type of chart you want, edit the layout and further design the widget.
Please comment and let us know what you think! This is your chance to have a say on what you want the future of MSPbots to be!
Regards,
Jack